Your organization has set SMART goals. You indicate what you want to achieve and guide the behavior of your employees or managers.
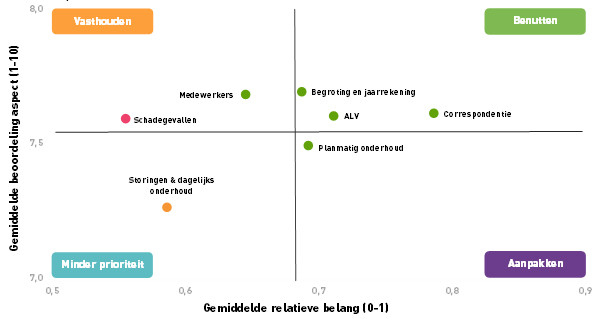
By conducting a satisfaction survey among your customers or employees, you can map out the satisfaction with all aspects of your service or work process. A logical follow-up question is: "And what should I improve first?" Using regression analysis, we map the relationship between the various aspects and overall satisfaction. This not only provides a picture of satisfaction with the aspect, but also of its importance. This can be visualized in a priority matrix.
A priority matrix shows the extent to which the assessments of the various aspects correlate with overall satisfaction. By combining this with the satisfaction score for the relevant aspects, we can divide the various aspects into four quadrants. From this, we can determine which aspects have the highest priority for improvement.
The four quadrants of the priority matrix:

.svg)
.svg)
.svg)
.svg)